
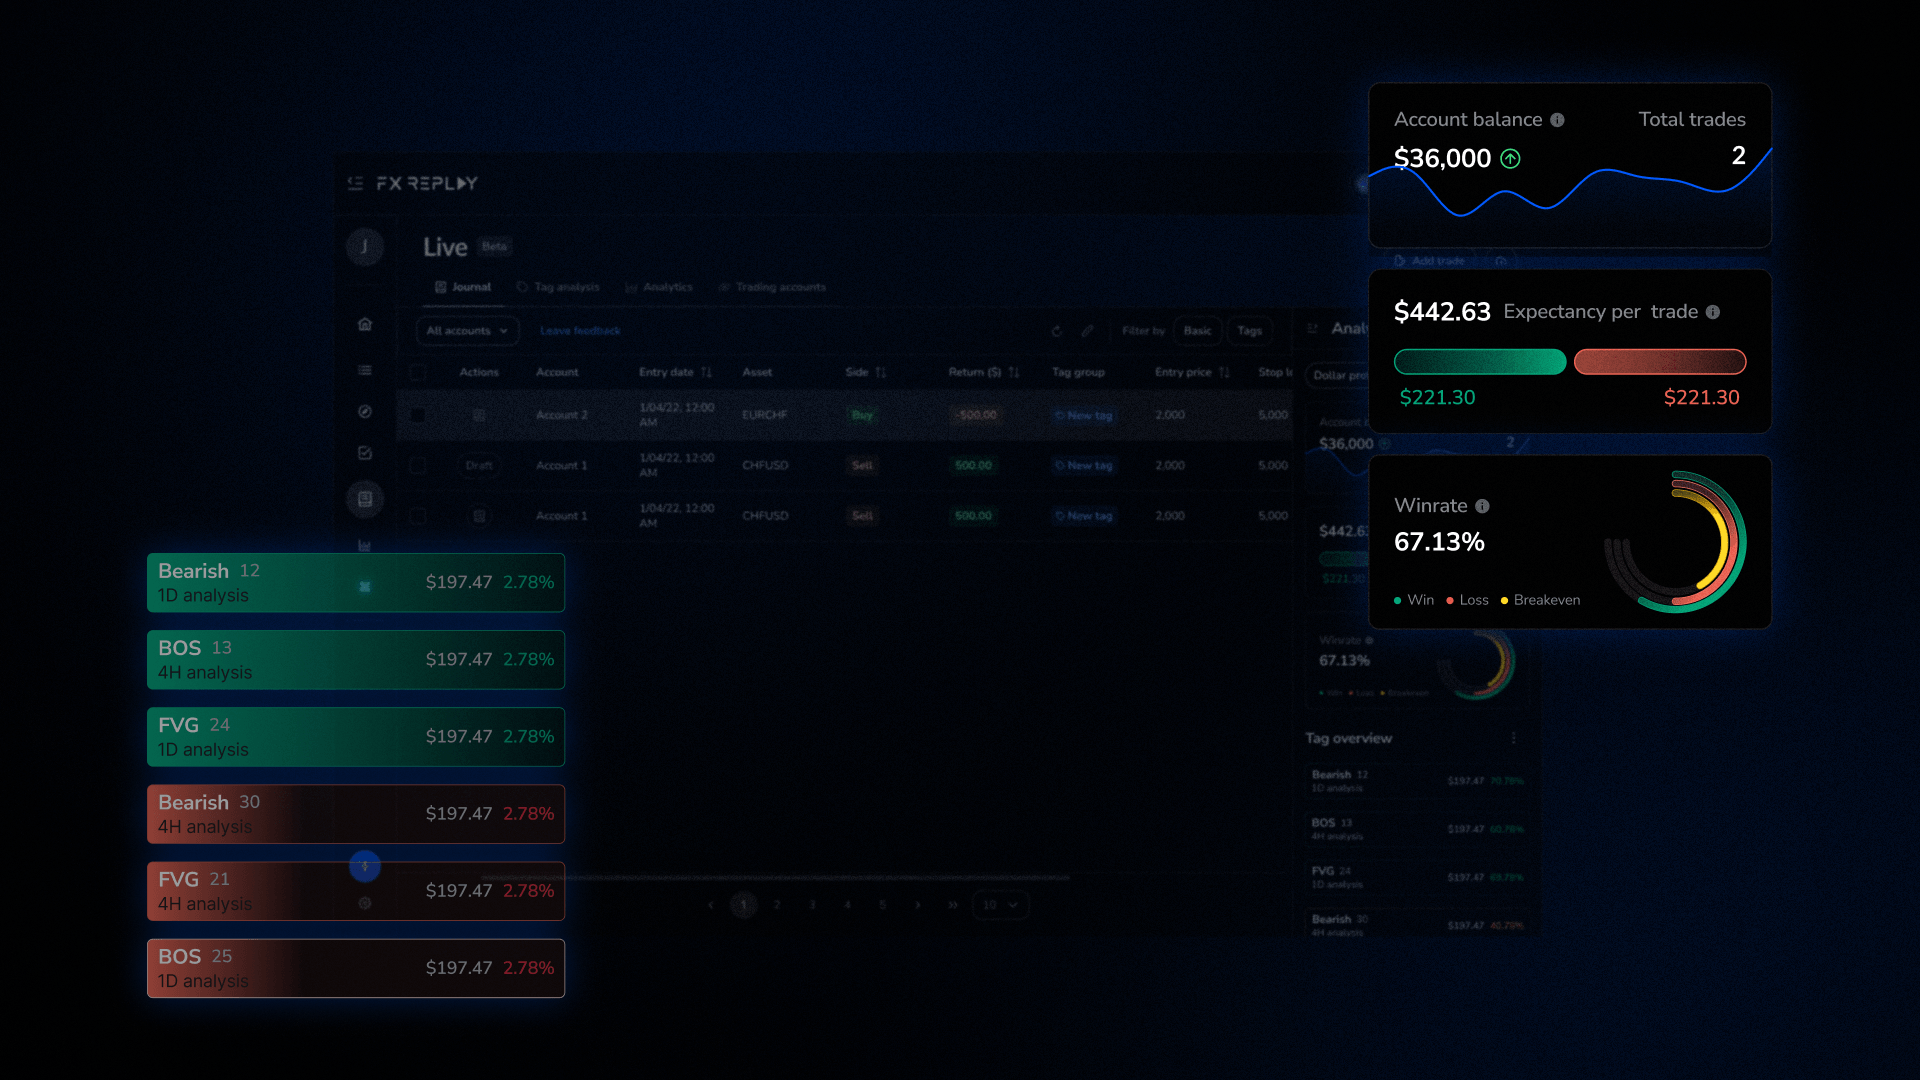
Turn your trading journal into a real edge. Learn how to analyze your trades, uncover patterns, eliminate mistakes, and build a data-driven strategy for consistent performance.
Most traders keep a journal but very few actually use it to improve. Logging trades is only the first step in the journaling process. The real edge comes from turning that data into clear, actionable insights that refine your strategy over time. Start by understanding how turning raw journal data into strategy insights actually works. In this guide, you’ll learn how to analyze your trading journal the right way, so you can identify what’s working, eliminate costly mistakes, and build a strategy grounded in real performance data. Whether you’re trading forex, indices, or crypto, this process helps you move from guesswork to consistent, data-driven decision-making.
Step 1: Focus on Key Metrics
Before diving into charts and screenshots, start with the numbers.
Core Metrics to Track:
- Win rate (%)
- Risk-to-reward ratio (R:R)
- Expectancy
- Average win vs. average loss
- Drawdown These metrics tell you whether your strategy is statistically viable.
Example Insight:
If your win rate is low but your R:R is high, your strategy may still be profitable, but only if executed consistently.
Step 2: Segment Your Data
Not all trades are equal. Break your journal into meaningful categories:
- Strategy (e.g., breakout, pullback, liquidity sweep)
- Market session (London, New York, Asia)
- Asset (EURUSD, NASDAQ, etc.)
- Timeframe
Why this matters:
You might discover:
- Your breakout strategy works best in New York session
- You lose money trading certain pairs
- One setup consistently underperforms
Step 3: Identify Your Best Setups
This is where your edge lives. Look for:
- Highest win rate setups
- Best R:R combinations
- Cleanest executions
Ask yourself:
- What conditions were present?
- Was the market trending or ranging?
- Did I follow my rules? Once identified, double down on these setups.
Step 4: Find and Eliminate Mistakes
Your journal will expose recurring errors:
- Entering too early
- Moving stop loss
- Overtrading
- Trading outside your plan
Pro tip:
Tag your mistakes in your journal so you can filter them later. Over time, your goal isn’t just better trades, it’s fewer bad habits. These are also common journaling mistakes that hide your edge without you realizing it.
Step 5: Use Visual Replay for Deeper Insight
Data tells you what happened. Replay shows you why. With FX Replay, you can:
- Rewatch your trades
- Analyze price action bar-by-bar
- See missed opportunities
Why replay matters:
- You spot hesitation and execution errors
- You understand market structure better
- You improve decision-making in real time Explore the FX Replay analytics dashboard to see your data in full context.
Step 6: Track Psychological Patterns
Your mindset directly impacts performance. Look for patterns like:
- Losses after a winning streak (overconfidence)
- Revenge trading after losses
- Hesitation after drawdown
Add notes like:
- “Felt rushed”
- “Not confident in setup”
- “Forced trade” Over time, you’ll see emotional trends that affect your results.
Step 7: Build Actionable Improvements
Analysis without action is useless. Create a system that recognizes problems, journal them, and turn insights into rules with better execution. This feedback loop will make it difficult to repeat emotional mistakes and manage risk better. For example, here are some of the problems vs rules you may encounter that can be solved through this method: FX Replay’s Live Journal makes this easier to track and tag so you can review your problem areas with precision. Try it here.
Step 8: Create a Feedback Loop
The best traders continuously refine their strategy.
Your loop should look like:
- Trade
- Journal
- Analyze
- Adjust
- Repeat This creates compounding improvement over time.
Common Mistakes When Analyzing Journal Data
Avoid these pitfalls:
- Looking at too few trades (small sample size)
- Ignoring losing trades
- Changing strategy too often
- Focusing only on profit instead of execution quality
Final Thoughts
Your trading journal is one of the most powerful tools you have but only if you use it correctly. By analyzing your data, identifying patterns, and refining your approach, you move from random results to intentional, data-driven trading. If you’re not reviewing your trades regularly, you’re leaving progress on the table.
Start Improving Your Strategy Today
Ready to take your journaling and backtesting to the next level?Use the FX Replay journal to track, analyze, and refine your trades now.
FAQ
How many trades do I need before analyzing my journal?
You need a meaningful sample size to draw reliable conclusions. Aim for at least 30–50 trades per setup or strategy before making adjustments. Anything less can lead to misleading insights.
What’s the most important metric to focus on?
There’s no single “best” metric, but expectancy is the most complete. It combines your win rate and risk-to-reward ratio to show whether your strategy is profitable over time.
What if my strategy looks good in data but I’m still losing?
This usually comes down to execution or psychology, not strategy. Check for: - Breaking your rules - Inconsistent position sizing - Emotional decisions Your journal notes and replay analysis are key here.
How do I know what my “A+ setups” are?
Your A+ setups are the ones that consistently show: - Strong win rate and/or high R:R - Clean, rule-based execution - Positive expectancy over time These are the setups you should prioritize and scale.
What’s the biggest mistake traders make with journaling?
Treating journaling as a passive activity. If you’re only logging trades but not analyzing patterns and adjusting your rules, you’re not improving—you’re just recording history.
.png)
.png)
.jpg)